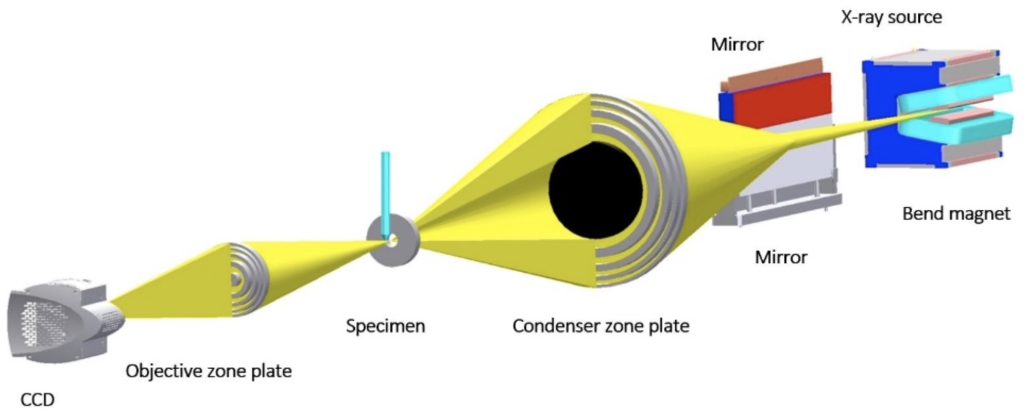
Soft X-ray Tomography (SXT) is a non-invasive, 3D imaging technique that can measure volumes, surfaces, interfaces, membranes, and organelle connectivity within an intact cell. SXT data are collected on a transmission soft x-ray microscope, in the case of the NCXT, this is XM-2 at the Advanced Light Source, the world’s brightest source of x-rays. The optical layout of XM-2 and the path the illumination takes through the specimen and onto the detector are shown Fig. 1. As can be seen, the optical configuration of XM-2 resembles that of a simple light microscope.
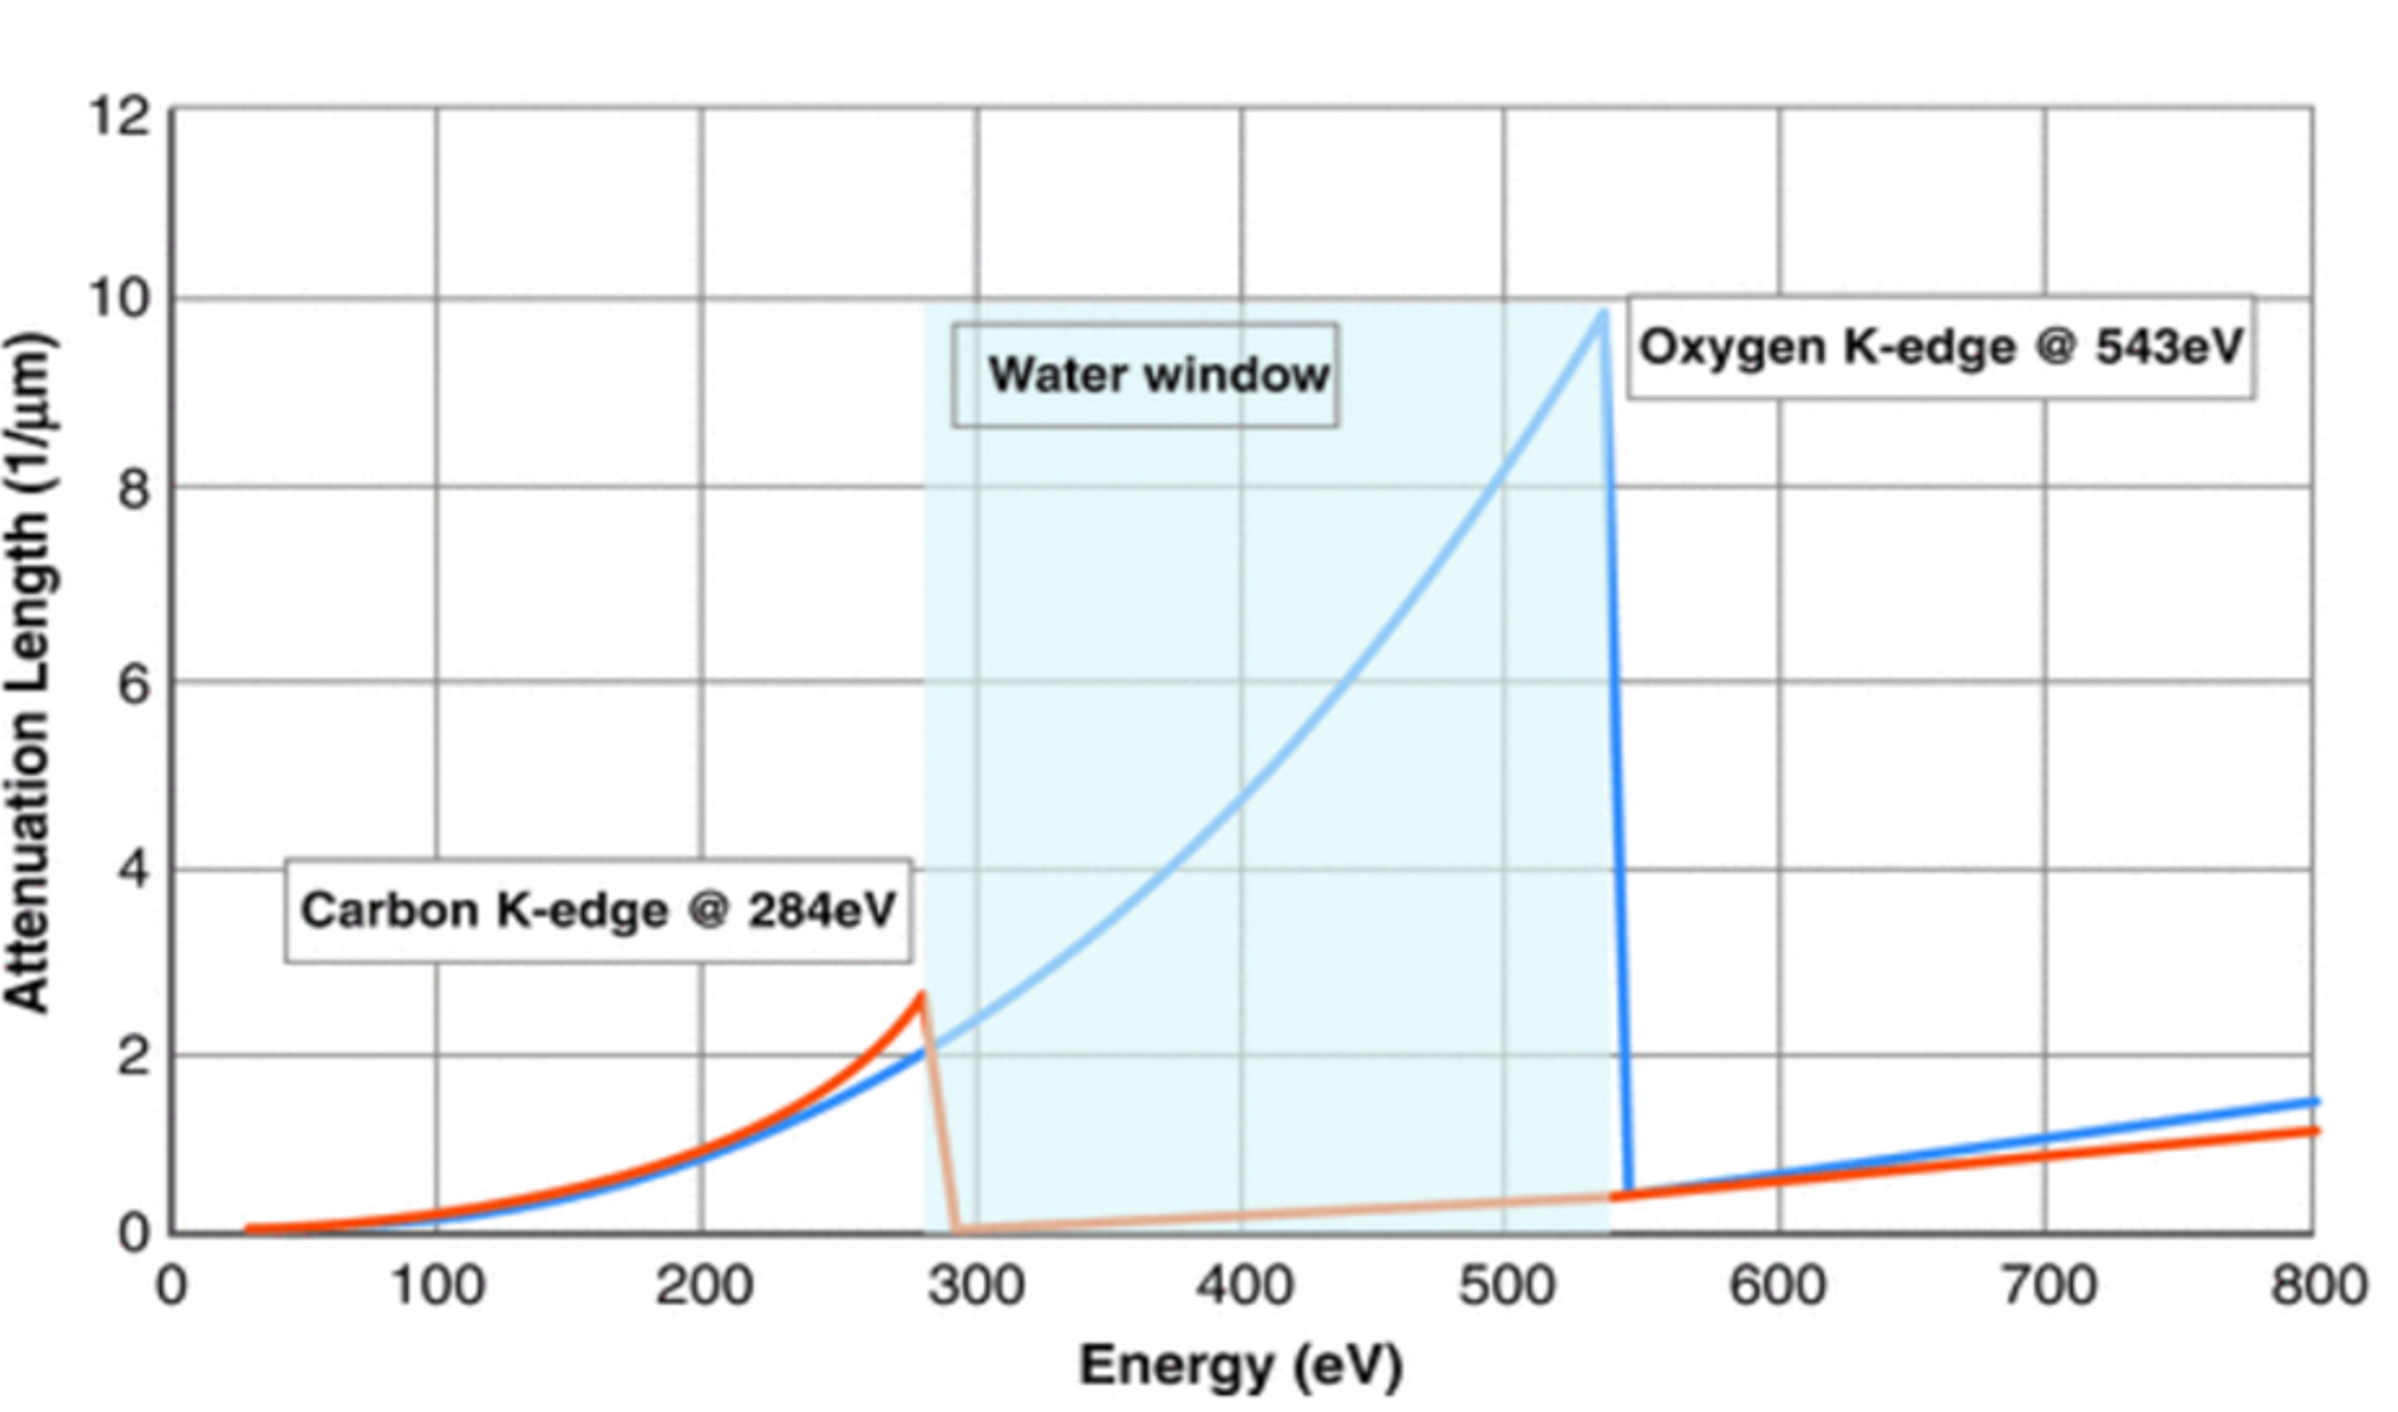
 In SXT, the specimen is illuminated with photons at energies from within the ‘water window’ (i.e., photon energies between the K-absorption edge of carbon at 282 eV and oxygen, 533 eV). As photons pass through the specimen, they are attenuated, as shown in Fig. 2. Image contrast is obtained directly from the measured attenuation of soft x-rays by the specimen. Photons in the water window are absorbed an order of magnitude more strongly by carbon- and nitrogen-containing organic materials than by water (see Fig. 3).
Consequently, subtle differences in the biochemical composition produce measurable contrast in soft x-ray images. Image contrast is, therefore, a quantitative measure of the density and species of biomolecules in each voxel in the tomographic reconstruction.
Each voxel in the reconstruction has an associated Linear Absorption Coefficient (LAC). As can be seen in Fig. 3, making it easy to identify subcellular structures and features in a tomogram.
The most significant imaging characteristics of SXT are:
- High spatial resolution: Full-field imaging at a spatial resolution of 35 nm or better.
- Wide applicability: Hydrated cells up to 12 µm thick can be imaged intact.
- Quantitative image contrast mechanism: Each voxel in a calculated reconstruction has an associated Linear Absorption Coefficient (LAC).
- High specimen throughput: Acquisition of a full tomographic series (180 projection images) from a field of view takes a few minutes. A subsequent field of view can be imaged by simply translating the specimen-containing capillary in the Z direction. A field of view can contain tens or even hundreds of bacteria, five to ten yeast cells, or one to three mammalian cells.
Once the tomographic data have been reconstructed, the 3D tomogram can be segmented to isolate and quantify sub-cellular features of interest.
 Soft X-ray microscopes have existed for many years, but it is only relatively recently that they have been successfully applied to imaging the cellular mesoscale. The reasons for this change are twofold. Firstly, a combination of technical advances – specifically, in the areas of detectors, X-ray sources, and optics – made soft X-ray microscopes capable of imaging cells more rapidly, and with higher spatial resolution. Secondly, cryogenic specimen rotation stages became available on soft X-ray microscopes, making tomographic data collection possible. Adopting a tomographic approach is essential for imaging the mesoscale organisation using a soft X-ray microscope. Without it, the microscope can only generate 2D projection images of the cell. In these projections, internal structures are superimposed on each other, making interpretation of the images virtually impossible. For more information see the SXT primer.
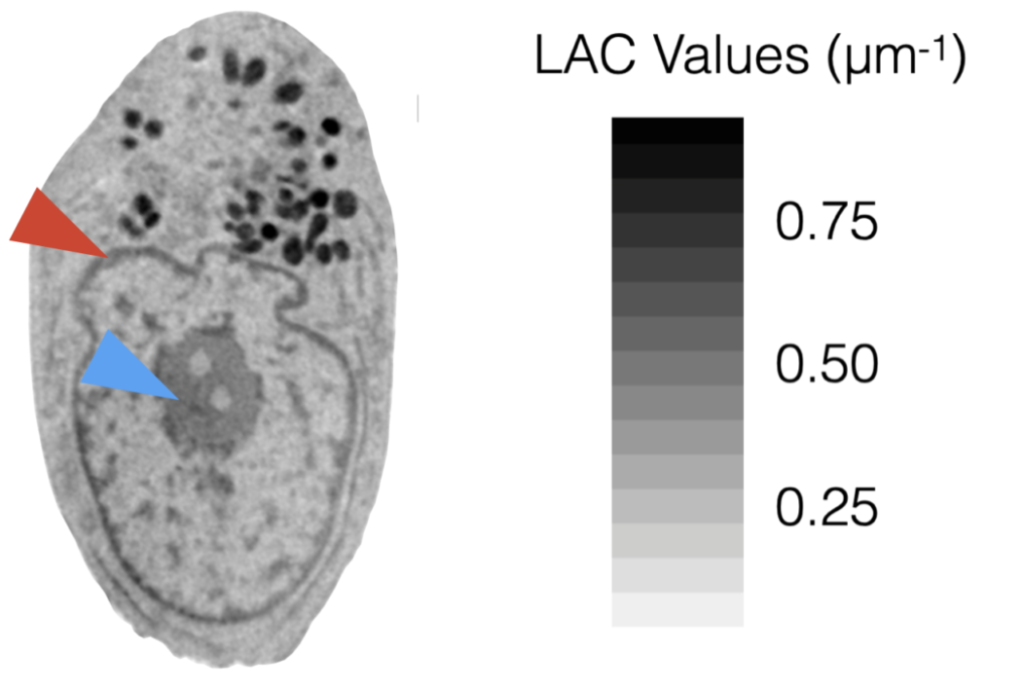 Figure 3. ‘Orthoslice’ – a one voxel thick through SXT reconstruction – of a cell. Greyscale values correspond to LAC values (regions that strongly attenuate soft x-rays, i.e. have a high density of carbon, are dark). Low carbon density regions have lower LAC values and appear lightly colored. Red arrowhead, the nuclear envelope; blue, nucleolus.
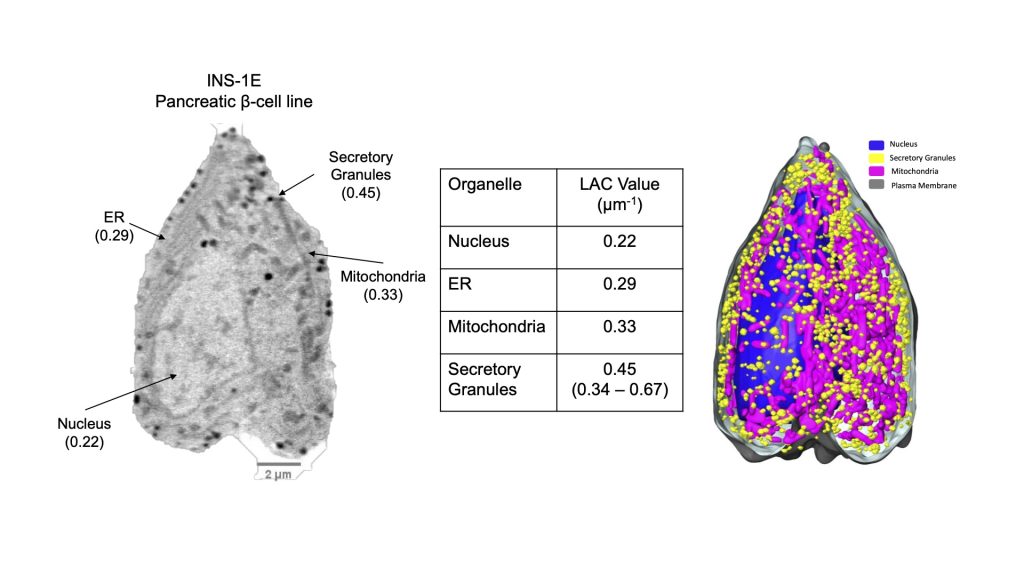 Figure 4. Segmented SXT reconstruction of a pancreatic β cell. Left: Single orthoslice through the SXT reconstruction. Right, the same cell after segmenting the major organelles. The table shows the average LAC values for each class of organelle. Segmentation was based on organelle LAC values. If necessary, morphological cues and subcellular location, together with fluorescence and electron microscopy data can be used to confirm the identity of a segmented object.